
Mathematical Literacy is often misunderstood. Many people call it “easy maths,” but that is a trap. In reality, it is “real-life maths.” To get a distinction, you need more than just a calculator; you need logic. You need to be able to calculate tax accurately, read complex maps, plan trips, and interpret the statistics you see in the news.
I have created this guide to break down the curriculum based on the Examination Guidelines, helping you focus exactly on where the marks come from.
Paper 1: Finance, Data Handling & Probability (150 Marks)
This paper deals with numbers, money, and statistics. Accuracy is everything here.
- Finance (±52 Marks)
This is usually the biggest section of the paper, so you need to master it. Here is what to focus on:
- Income & Expenditure: You will likely be asked to calculate profit/loss or work with personal budgets. The trick here is to be careful with monthly vs. annual calculations.
- Interest Rates: Students often mix up the formulas. Remember:
- Simple Interest ( A = P(1 + in) ) is generally for hire purchase or loans.
- Compound Interest ( A = P(1 + i)^n ) is used for investments and inflation. If the question mentions “inflation,” you must use the compound formula.
- Banking: Make sure you can read a bank statement. Look out for transaction fees and how they add up.
- Taxation: This is where many students lose easy marks.
- Income Tax: You will be given tax tables. Practice calculating tax for different salary brackets. Crucial Step: Don’t forget to subtract the rebates (Primary/Secondary) at the end!
- VAT: Know how to add 15% ( \times 1.15 ) and how to remove it ( \div 1.15 or \times \frac{100}{115} ).
- Tariff Systems: This involves calculating water or electricity costs using sliding scales (step tariffs). The higher the consumption, the higher the price per unit.
- Data Handling (±37 Marks)
- Summarising Data: You must know the difference between Mean, Median, Mode, Range, and Quartiles (Q1, Q2, Q3).
- Representing Data: Examiners love asking you to draw or interpret Bar graphs, Histograms, Pie charts, and Line graphs.
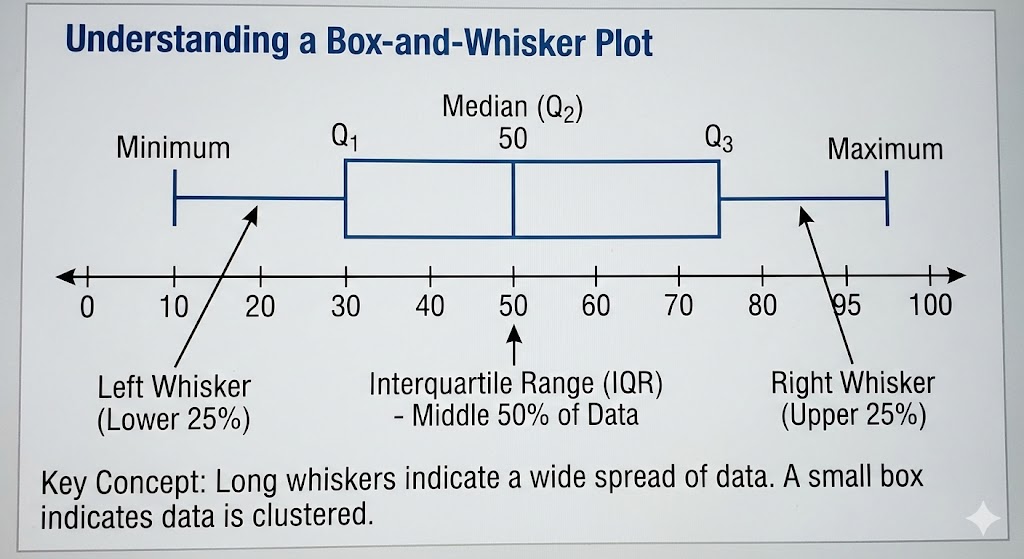
- The Box-and-Whisker Plot:
Look at the diagram below. This plot shows us the “spread” of data. You need to be able to draw one from a set of numbers and explain what it means. If the “box” is small, the data is clustered together. If the “whiskers” are long, the data is spread out.
- Probability (±23 Marks in Paper 1)
In Paper 1, probability is often about prediction. You might be asked, “What is the chance of X happening?”.
- Representations: Make sure you can draw Tree Diagrams and Two-way tables to show all possible outcomes.
- Terminology: Don’t just use numbers; know how to use words like “Certain,” “Impossible,” “Likely,” and “Unlikely”.
Paper 2: Maps, Plans, Measurement & Probability (150 Marks)
This paper tests your spatial awareness and ability to work with physical objects.
- Maps, Plans and Other Representations (±45 Marks)
- Scale:
- Bar Scale: This is the safest scale to use. You simply measure the bar with a ruler and convert it.
- Number Scale: (e.g., 1 : 50\,000 ). This means 1 cm on the map equals 50,000 cm in reality.
- Maps: You will need to navigate Street maps (using grid references like A3), Strip charts (distance tables), and Elevation maps (showing uphill/downhill gradients).
- Plans: Be comfortable with Floor plans (identifying windows and doors) and Assembly diagrams (like those IKEA-style instructions).
- Measurement (±60 Marks)
This is usually the hardest section for students, mostly due to unit conversions.
- Conversions: You must memorize the conversion factors (10, 100, 1000). You need to move effortlessly between mm, cm, m, and km, as well as ml and litres.
- Formulas: In Maths Lit, you are GIVEN the formulas, but you get zero marks if you don’t know how to use them. You will need to calculate:
- Perimeter & Area: For rectangles, triangles, and circles.
- Volume: For prisms and cylinders.
- Surface Area: The total outside area of a 3D object.
- BMI: Calculating Body Mass Index.
Decksh’s Top 3 Tips for a Distinction
In my experience, specific habits separate the “average” students from the distinction candidates. Here is what you need to master:
1. The “Justification” Mark
Maths Lit asks “Why?” a lot. You will often see questions like, “Does the claim make sense?”.
- The Trap: Answering with just “Yes” or “No.”
- The Solution: Always back up your answer with a calculation.
- Example Answer: “No, the claim is wrong because my calculation shows R500, but he said R400.”
Without the calculation, your opinion is not worth any marks.
2. Master the “Tax Table”
Every single year, there is a tax question. It is free marks if you practice it.
- The Golden Rule: Calculate the tax on the entire amount inside the bracket first.
- The Final Step: Never forget to subtract the rebates (Primary and/or Secondary). If you forget the rebate, your final answer will be wrong.
3. Read the Scenario Carefully
Maths Lit questions are wordy. Before you touch your calculator, grab a highlighter.
- Look for keywords like “including VAT” vs. “excluding VAT.”
- Using the wrong starting number is the most common reason students fail a question before they even begin.
Conclusion
Mathematical Literacy is about logic and accuracy. If you can read a tariff table correctly, interpret a floor plan, and justify your answers with math, you will do well.
Good luck with your Matric Finals!