
STA1610 is where many students first encounter “real” statistics. Unlike high school, where you could often get by with common sense, this module requires you to understand probability theory, sampling distributions, and the logic of hypothesis testing.
The secret to passing STA1610 is knowing which calculator mode to use and understanding the why behind the formulas. This guide breaks down the critical sections you need to master.
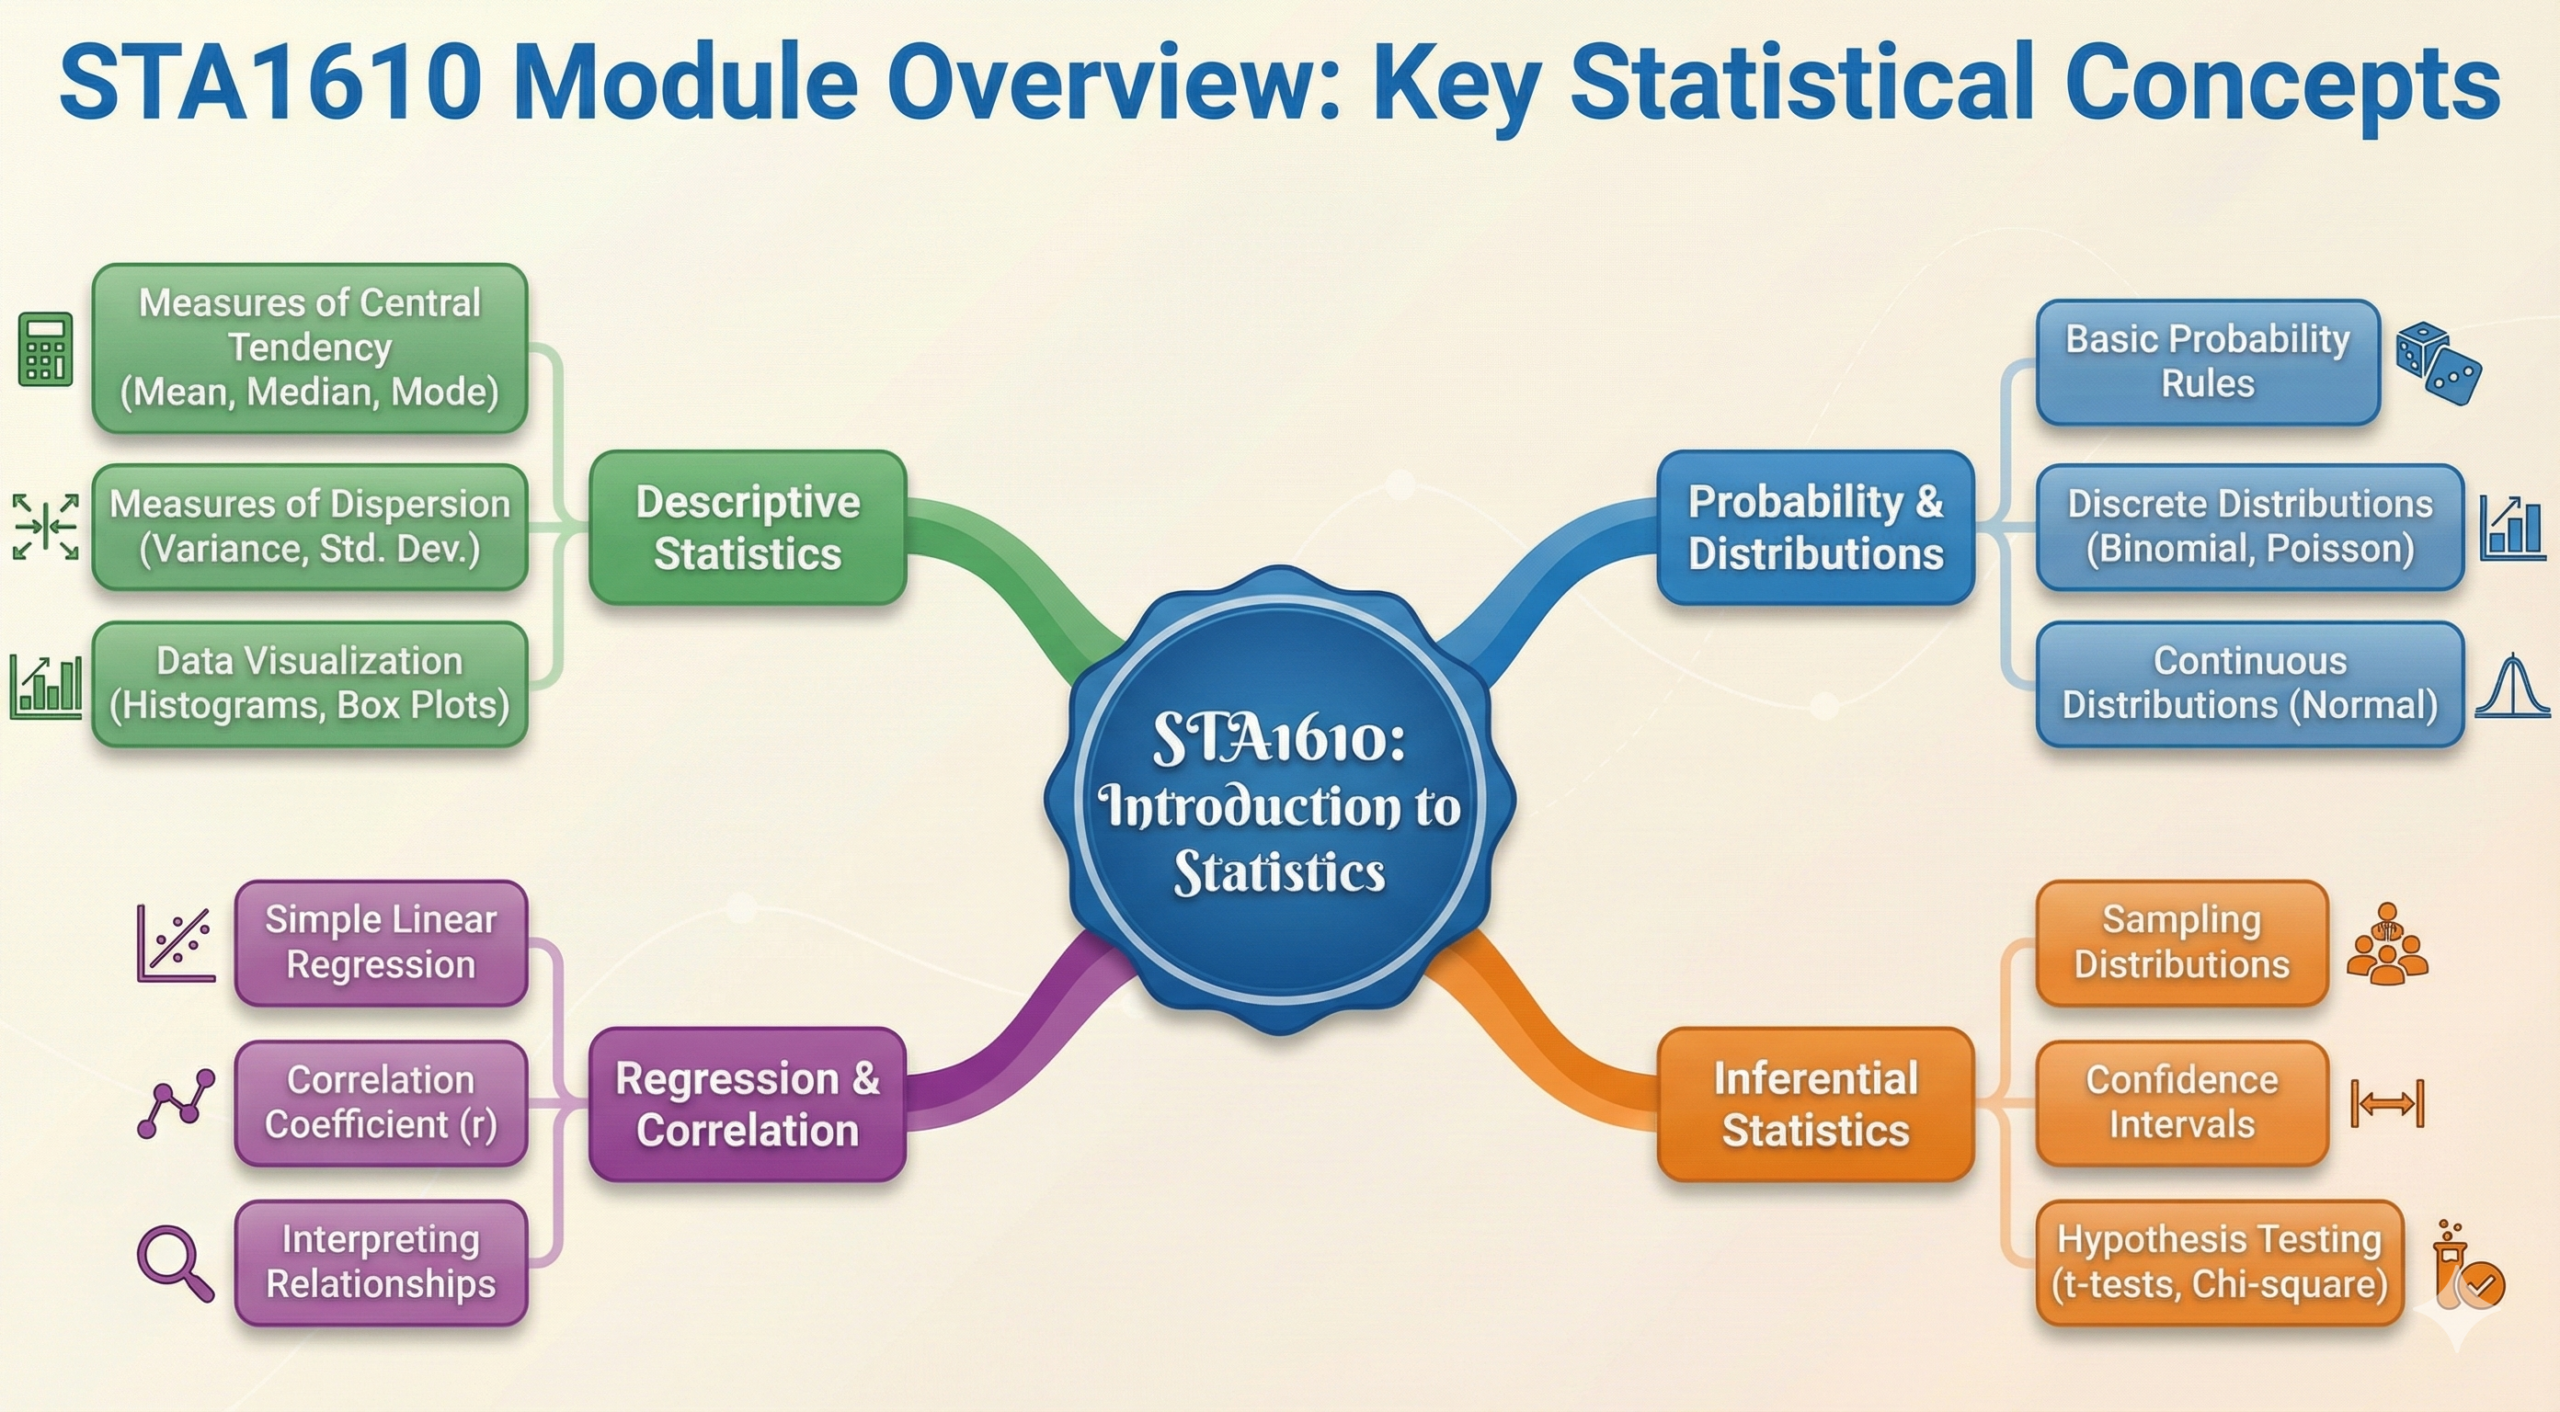
1. Descriptive Statistics & Probability
This is the foundation. You need to be fluent in the language of data.
Graphical Representation
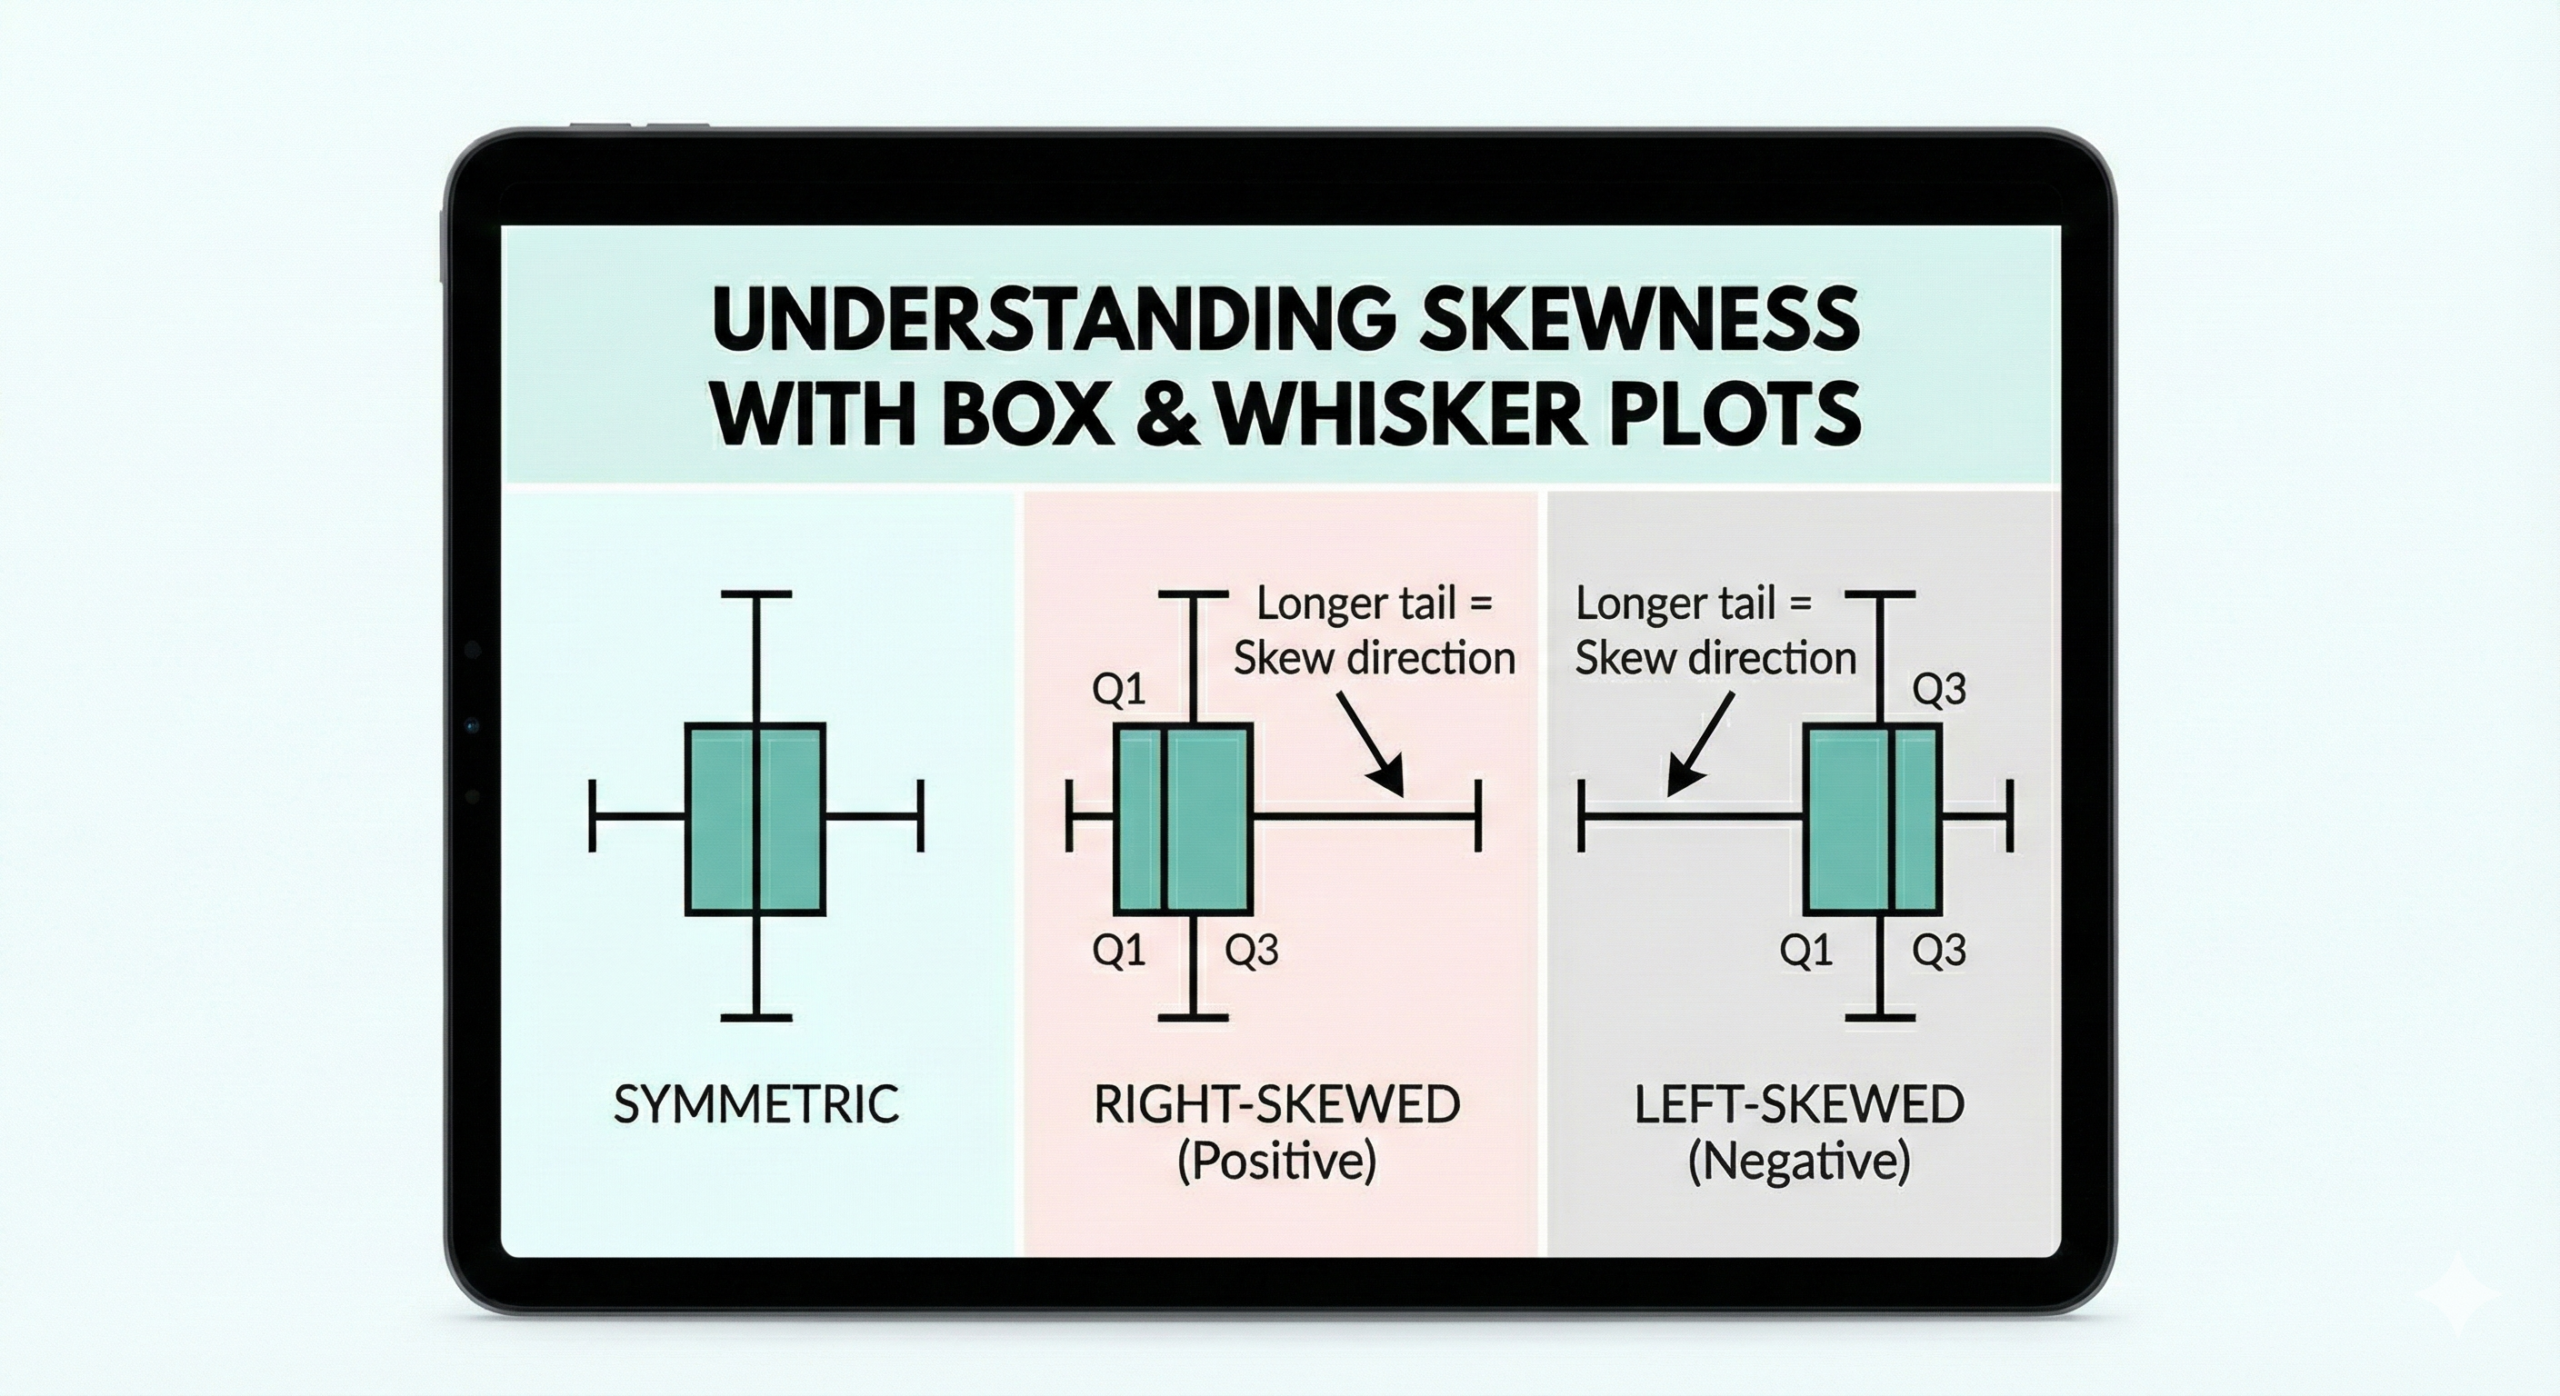
You will work with Histograms, Box-and-Whisker plots, and Scatter plots.
- Skewness: You must be able to look at a Box-and-Whisker plot and instantly tell if the data is skewed left or right. If the “whisker” on the right is longer, it’s positively skewed (skewed to the right).
- Scatter Plots: Understand the correlation coefficient (r). If the dots form a tight line going up, r is close to +1 (strong positive correlation).
Probability Theory
This is often the hardest section for students.
- The Rules: Memorize the Addition Rule (P(A \cup B) = P(A) + P(B) - P(A \cap B)) and the Multiplication Rule for independent events (P(A \cap B) = P(A) \times P(B)).
- Bayes’ Theorem: This involves “flipping” conditional probabilities. Draw a tree diagram to visualize the paths; it makes the formula much easier to apply.
2. Probability Distributions
You move from single events to patterns of events.
Discrete Distributions
- Binomial Distribution: Used for “Success/Failure” experiments (e.g., flipping a coin 10 times). You need to know n (trials) and p (probability of success).
- Poisson Distribution: Used for counting events over time or space (e.g., number of cars arriving at a tollgate in an hour). Here, you just need the average rate (\lambda).
The Normal Distribution
This is the most important distribution in Statistics.
- The Bell Curve: You must be able to standardize any value to a Z-score using the formula:
Z = \frac{X - \mu}{\sigma}
- Reading the Table: Once you have a Z-score, you must know how to look it up in the Standard Normal table to find the probability.
3. Statistical Inference
This is the core of “university stats.” You use sample data to make guesses about the whole population.
Sampling Distributions
- Central Limit Theorem: This magic theorem says that if your sample size (n) is large enough (usually >30), the distribution of the sample means will be Normal, even if the original data wasn’t!
Confidence Intervals
You calculate a range (e.g., 95%) where the true population mean likely lies.
- The Formula:
\bar{x} \pm Z \times \left( \frac{\sigma}{\sqrt{n}} \right)
- Interpretation: You aren’t 95% sure the mean is there; you are saying that if you took 100 samples, 95 of the intervals you created would contain the true mean.
Hypothesis Testing
This is the 5-step procedure you must memorize.
- State Hypotheses: Null (H_0) and Alternative (H_1).
- Select Level of Significance: Usually \alpha = 0.05.
- Calculate Test Statistic: Is it a Z-test or a t-test? (Use t if n < 30 and population variance is unknown).
- Decision Rule: Reject H_0 if the p-value is less than \alpha.
- Conclusion: “There is sufficient evidence to support…”
Decksh’s Top 3 Tips for Distinction
Tip 1: Calculator Proficiency
Your scientific calculator (Casio fx-991ZA or similar) can do 50% of the work for you.
- Stat Mode: Learn to enter your data and instantly get the Mean (\bar{x}) and Standard Deviation (s).
- Linear Regression: Your calculator can find the equation of the line (y = A + Bx) and the correlation (r) in seconds. Don’t calculate these manually unless you have to show steps.
Tip 2: Identify the Distribution
The hardest part of an exam question is figuring out which distribution to use.
- “Success/Failure” + fixed trials = Binomial.
- “Average rate” + time/space = Poisson.
- “Bell-shaped” or “Continuous data” = Normal.
Tip 3: Master the “p-value”
In Hypothesis Testing, modern exams focus on the p-value approach.
- The Rule: If p is low, the Null must go. (If p < 0.05, reject H_0). This simple rhyme will save you marks.
Conclusion
STA1610 is about logic and procedure. Don’t get lost in the algebra; focus on choosing the right test for the right situation. If you master the Normal Distribution and the 5 Steps of Hypothesis Testing, you will pass this module with flying colors.
Good luck!