
ICT2621 is not a coding module; it is a Process Modeling module. You are learning to think like a Systems Analyst. Your job is to take a messy business problem (like “A manual library system that keeps losing books”) and structure it into a clear set of diagrams that a programmer can build.
The exam relies on your ability to draw Data Flow Diagrams (DFDs) and build Decision Tables. If you can master these two skills, you pass. If you mess up the “Balancing” rule in DFDs, you fail.
This guide breaks down the core deliverables you need to master.
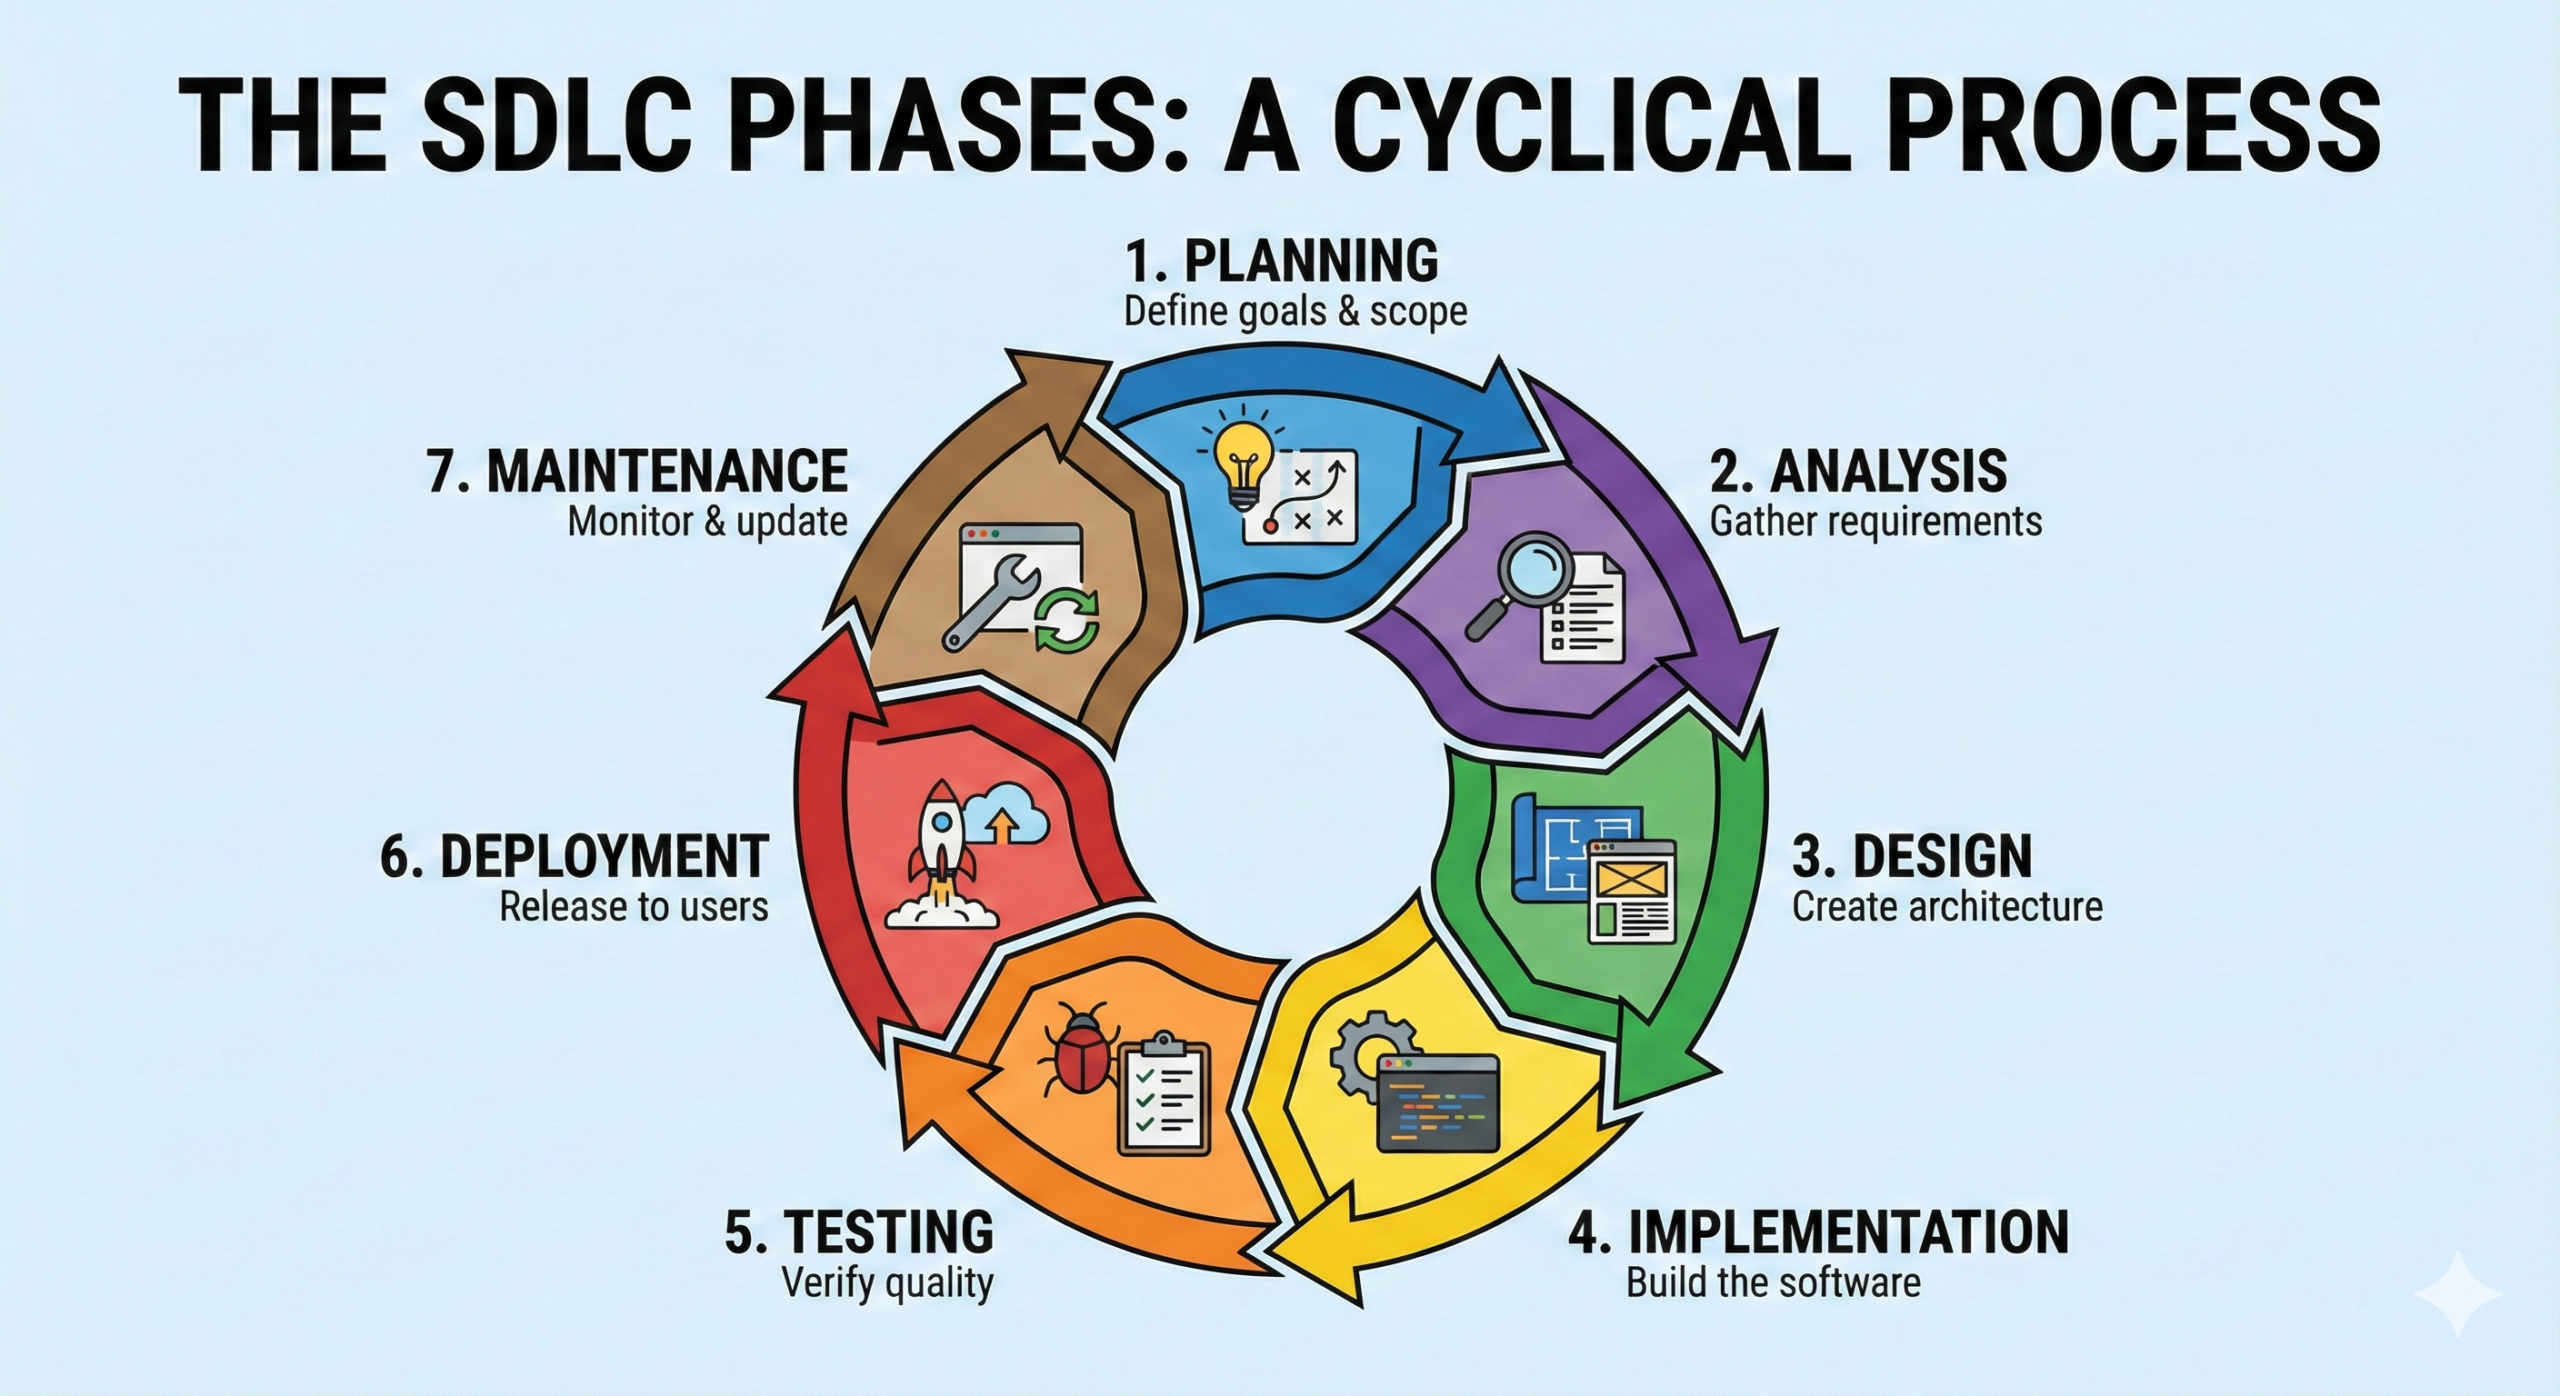
1. The Systems Development Life Cycle (SDLC)
This is the roadmap. You don’t just need to memorize the phases; you need to know the Deliverables.
- Planning: Deliverable = Feasibility Study (Can we afford this?).
- Analysis: Deliverable = System Requirements (What must it do?). This is where DFDs live.
- Design: Deliverable = System Specifications (How will it work technically?).
- Exam Tip: If a question asks “In which phase do we interview users?”, the answer is Analysis. If it asks “In which phase do we choose the database software?”, the answer is Design.
2. Data Flow Diagrams (The Core Skill)
This is usually 40% of the exam paper. You trace how data moves through the system.
The Symbols
- Process (Rounded Rectangle): Must be a Verb (e.g., “Calculate Pay”). It transforms data.
- Data Flow (Arrow): The data moving (e.g., “Hours Worked”).
- Data Store (Open Rectangle): Where data sits (e.g., “Employee File”).
- External Entity (Square): Who sends/receives data (e.g., “Customer”).
The 3 Levels of DFDs
You must understand the hierarchy:
- Context Diagram: The “Big Picture.” It shows the System as one single process (Process 0) in the middle, surrounded by External Entities. Rule: No Data Stores are shown here!
- Diagram 0: The “Zoom In.” You break the single process into major steps (Process 1.0, 2.0, 3.0) and show the main Data Stores.
- Child Diagrams: The “Micro View.” You break Process 1.0 into 1.1, 1.2, etc.
3. Logic Modeling (Decision Tools)
When a process is complex (e.g., “Calculate Discount”), you can’t just draw a box. You need to explain the rules.
Decision Tables
This is the most precise tool.
- Quadrants:
- Conditions (Top Left): “Is customer loyal?”, “Is order > $100?”
- Actions (Bottom Left): “Give 10% discount”, “Charge shipping.”
- Rules (Right Side): The columns where you mark Y/N (Yes/No) and X (Execute).
- Simplification: You will often be asked to “Simplify the Table.” If two rules result in the same action and only differ by one condition, you can combine them using a dash (-).
Structured English
This looks like code but isn’t. Use standard programming keywords in CAPITALS.
IF Customer is VIP THEN
    CALCULATE Discount = 10%
ELSE Discount = 0%
4. Logical vs. Physical Design
This is a theoretical trap.
- Logical DFD: Shows what the business does (e.g., “Process Order”). It ignores technology.
- Physical DFD: Shows how it is done (e.g., “Scan Barcode,” “Update SQL Database”). It includes hardware and software details.
Decksh’s Top 3 Tips for a Distinction
Tip 1: The “Balancing” Rule
This is where most students lose marks.
- If your Context Diagram has 3 Inputs and 2 Outputs, your Diagram 0 must have exactly the same 3 Inputs and 2 Outputs entering/leaving the system boundaries.
- If data disappears or appears out of nowhere, your diagrams are “Unbalanced.”
Tip 2: Avoid “Black Holes” and “Miracles”
Check every Process box you draw.
- Black Hole: A process has inputs but no outputs. (Data goes in and dies).
- Miracle: A process has outputs but no inputs. (Data is created from magic).
- Rule: Every process must have at least one input and one output.
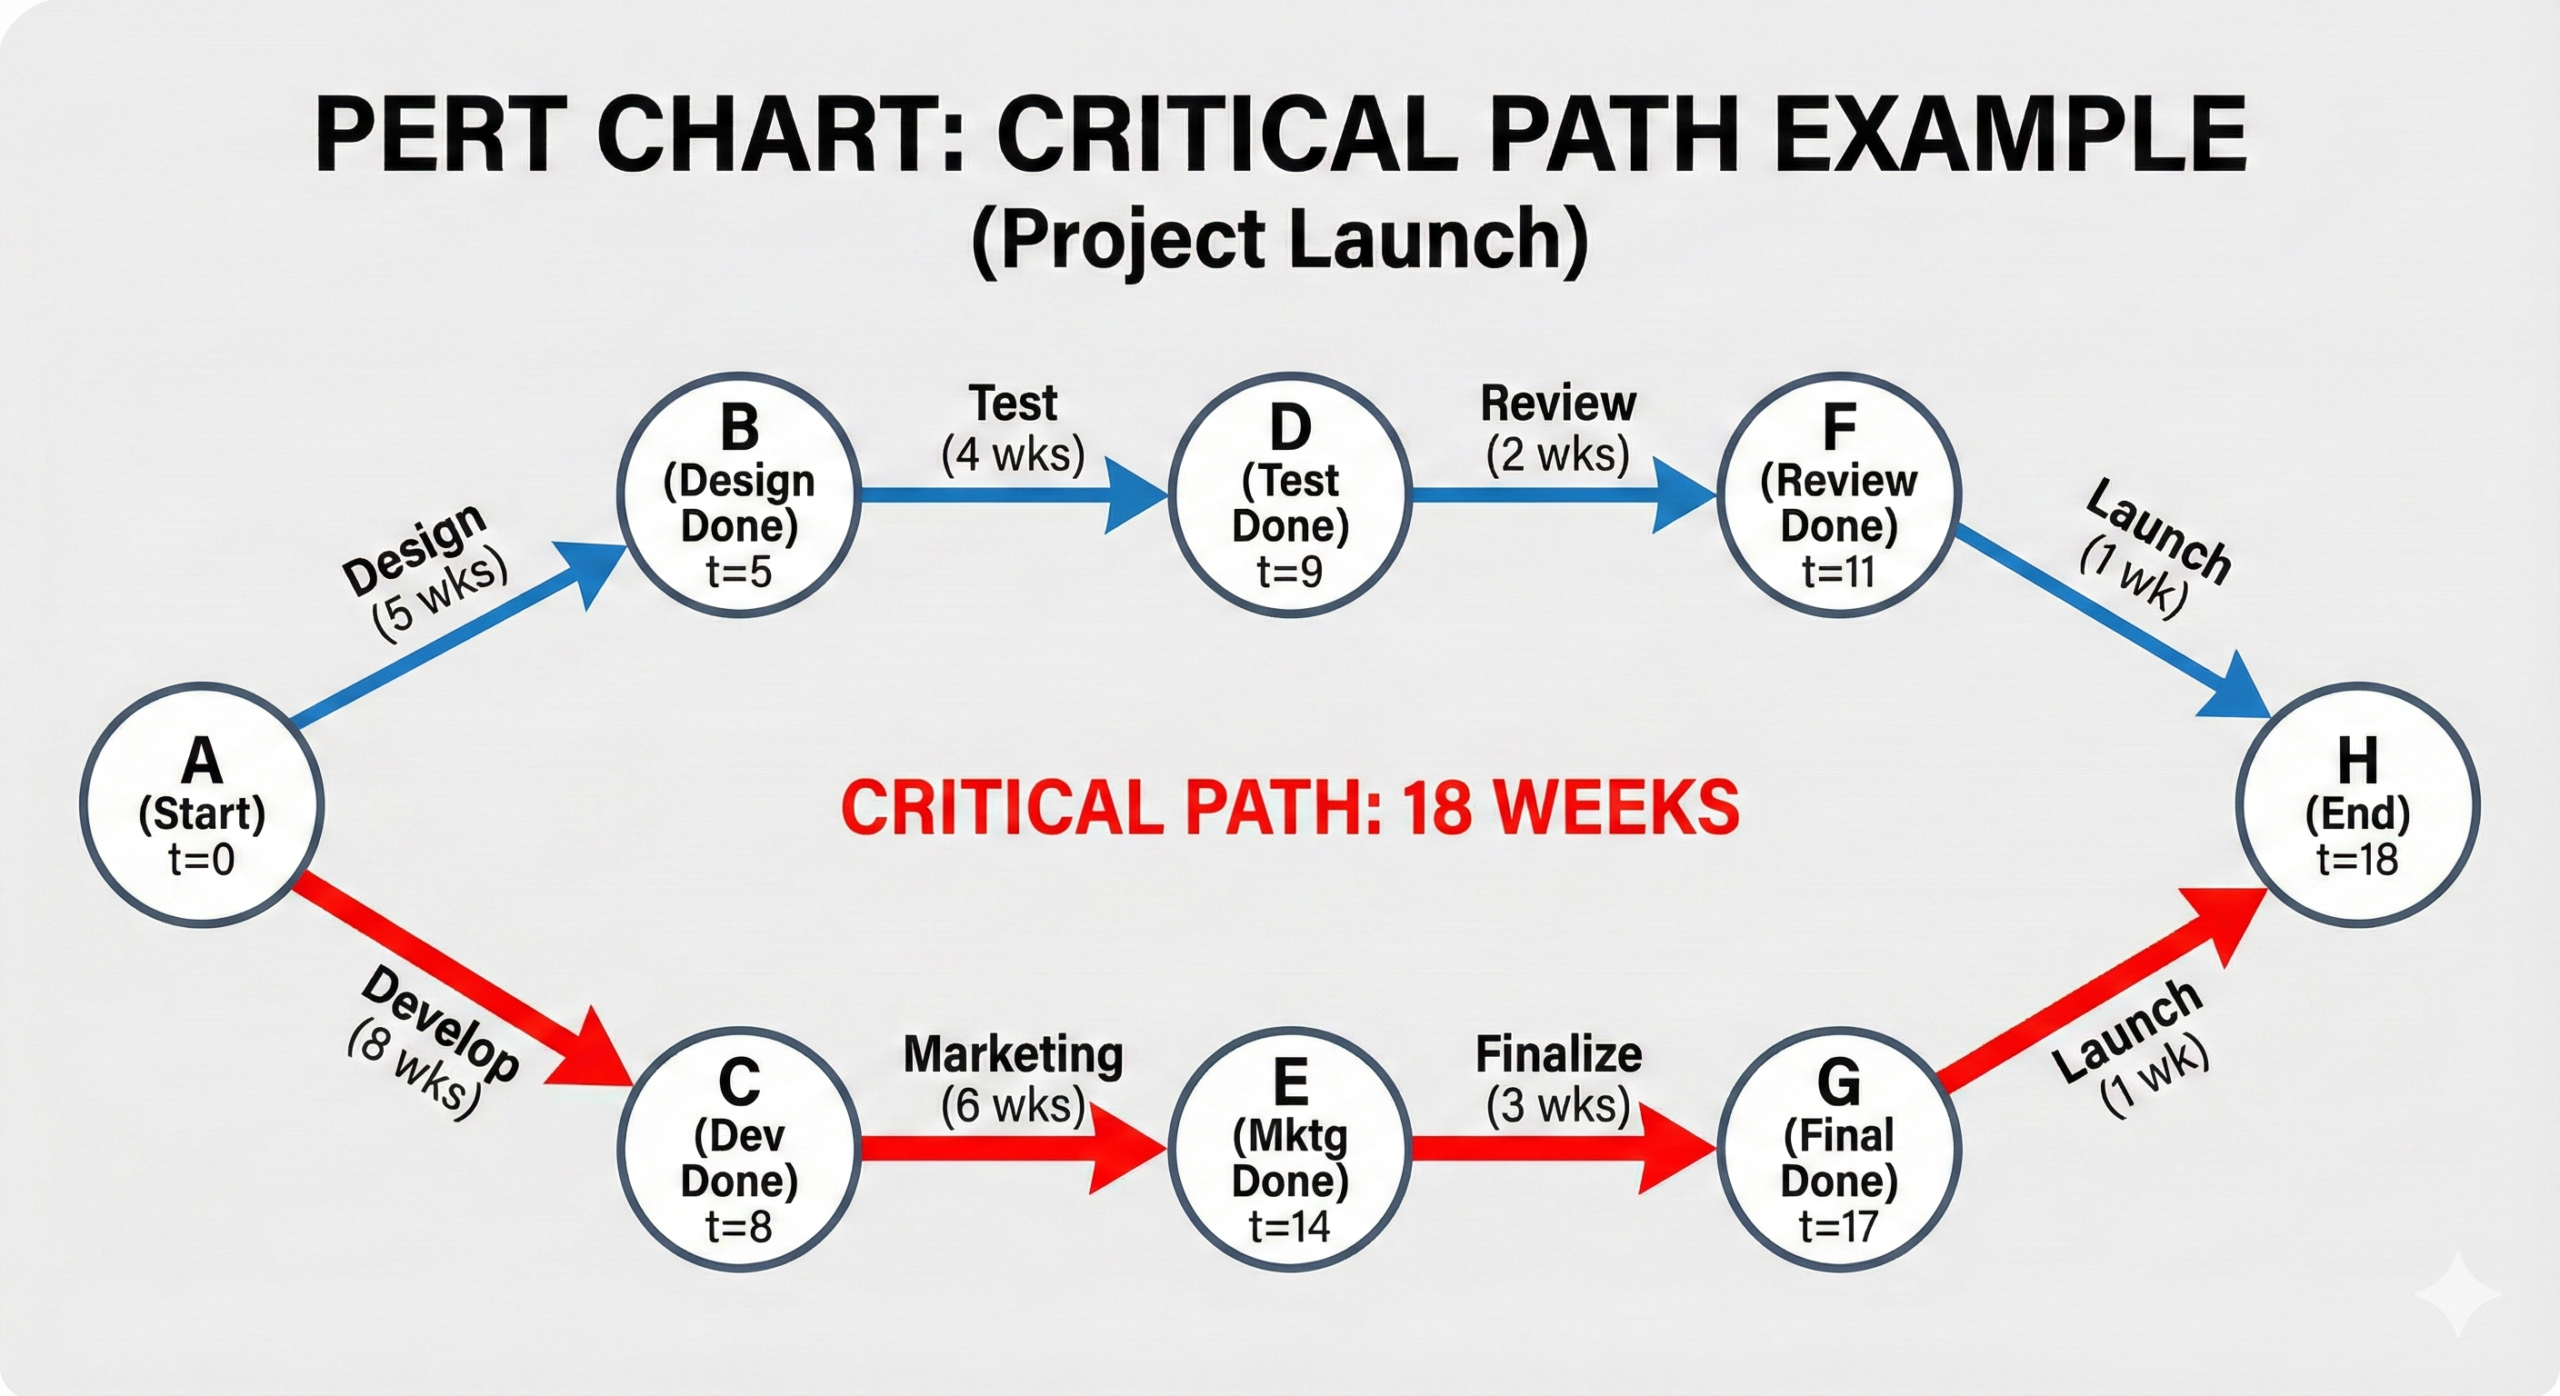
Tip 3: PERT Charts (Critical Path)
In Project Management questions, you will calculate the “Critical Path.”
- Don’t just look for the path with the most tasks.
- Look for the path that takes the longest time. This dictates the shortest possible time to complete the project.
Conclusion
ICT2621 requires you to be neat and logical. Use a ruler for your diagrams. Label your data flows clearly (use nouns like “Invoice,” not verbs like “Send Invoice”). If you master the Decision Table and the Context Diagram, you are safe.
Good luck!